COMP 7507 - UCL Football Analytics
Explore data visualizations for UEFA Champions League football matches and players.
Project Objective
Our primary objective is to empower football coaches and analysts with insightful tools derived from historical UEFA Champions League data. Through a series of interactive visualizations and analyses, we aim to provide a comprehensive understanding across various aspects of the game:
- League Level Analysis: Gain a macro perspective on league-wide trends and team performance.
- Match Level Analysis: Dive into individual match dynamics, identifying key events and strategic insights.
- Defensive Strategies Analysis: Understand the effectiveness of different defensive formations and player contributions.
- Player Level Analysis: Evaluate individual player performance, tracking metrics to assess how specific players on a team performed.
These tools are designed to facilitate data-driven decision-making, helping coaches optimize strategies and improve team and player performance.
Our Approach
Our project involved a comprehensive analysis of UEFA Champions League football matches and player data. We adopted a multi-faceted approach to extract insights and present compelling visualizations:
- Data Extraction & Cleansing (Python): We utilized Python for robust data extraction from various sources and performed thorough cleansing to ensure data quality and consistency.
- Interactive Visualizations (Tableau): Tableau was employed to create interactive dashboards, allowing for dynamic exploration of UCL match statistics and individual player performance metrics. These visualizations aim to provide deep insights into game dynamics and player contributions. You can view our Tableau dashboards in the section below.
- Dynamic Visualizations (Python): In addition to static dashboards, we also prepared a dynamic visualization using Python. You can find this video demonstration in the dedicated section further down the page.
Project Report (PDF)
Tableau Dashboards
Dashboard 1a: UCL League Overview
This dashboard provides an overview of the UEFA Champions League for the season, including league-wide statistics and trends.

Dashboard 1b: UCL League Overview
This dashboard provides an overview of the UEFA Champions League for the season, including league-wide statistics and trends.

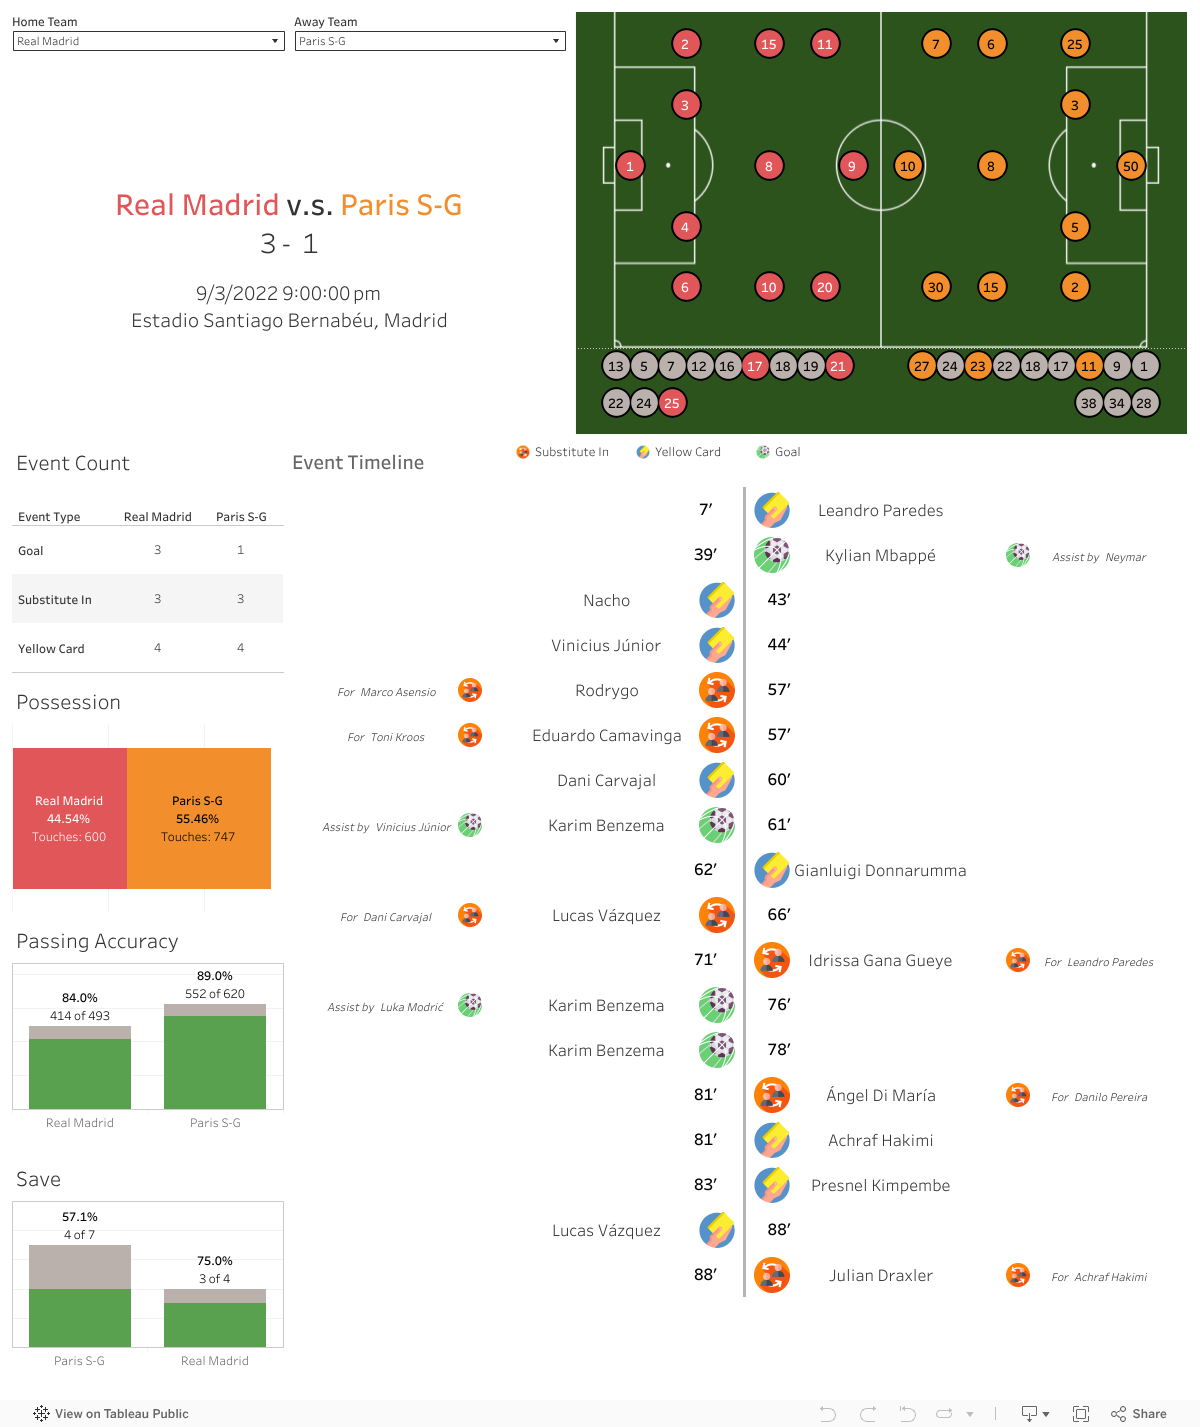
Dashboard 2: Match Level Analysis
This dashboard displays match-level data, including key statistics, key events and formation map.
Defensive Strategies
Dashboard 3a: Overview Dashboard - Defense
This dashboard provides a general overview of defensive metrics, offering a broad perspective on various football statistics related to defense.

Dashboard 3b: Player Database - Defense
This dashboard allows for exploration of player-centric data, providing insights into individual defensive performance.

Dashboard 3c: Heatmap Database
This dashboard presents heatmaps, visualizing player movement and activity across the field.

Player Level
Dashboard 4a: Player Details
Explore detailed statistics and performance metrics for individual players.

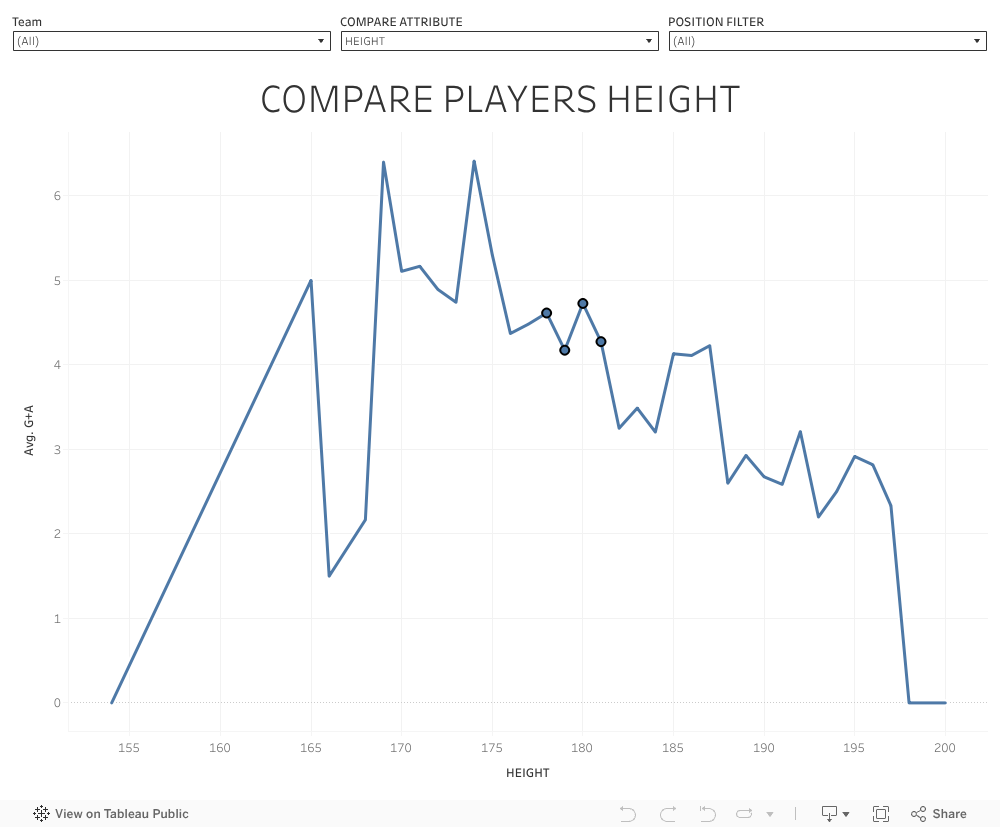
Dashboard 4b: Compare Player Attributes
Compare performance metrics between different players side-by-side.
Python Demo: Dynamic Visualization
This section will feature a dynamic visualization created using Python. It aims to provide a unique and interactive perspective on the data that complements our static dashboards.
Our Team
| Student Name | Student ID |
|---|---|
| Lee Wing Chun | 3036212881 |
| Pan Jia Chen | 3036383094 |
| Md Tanjeeb Hossain | 3036199560 |
| Asif Salam | 3036383446 |
| A M M Mutasim Moyen | 3036383226 |